Energy Consumption for Heating and Cooling: Part 3.
Consumption over course of the day
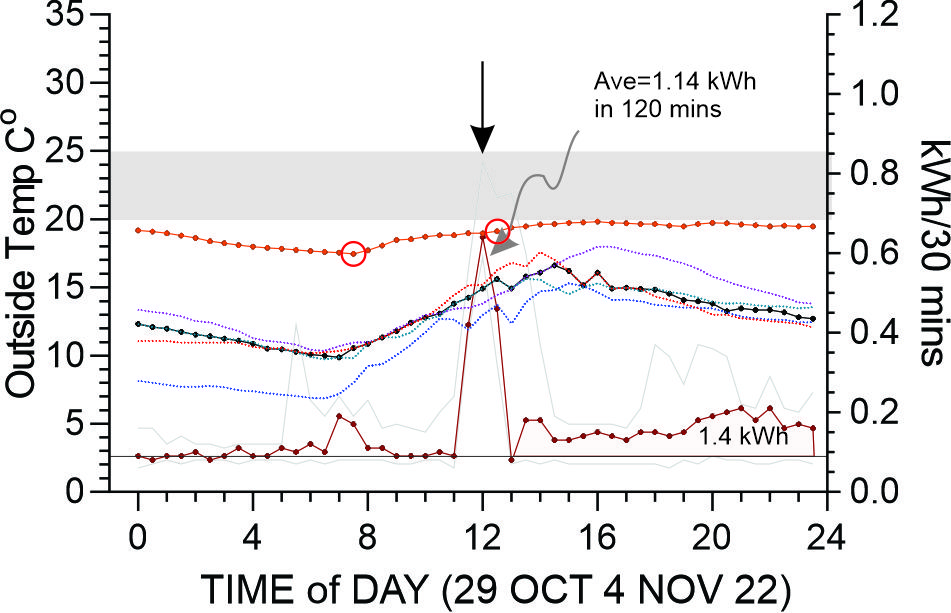
29 October - 4th November 2022
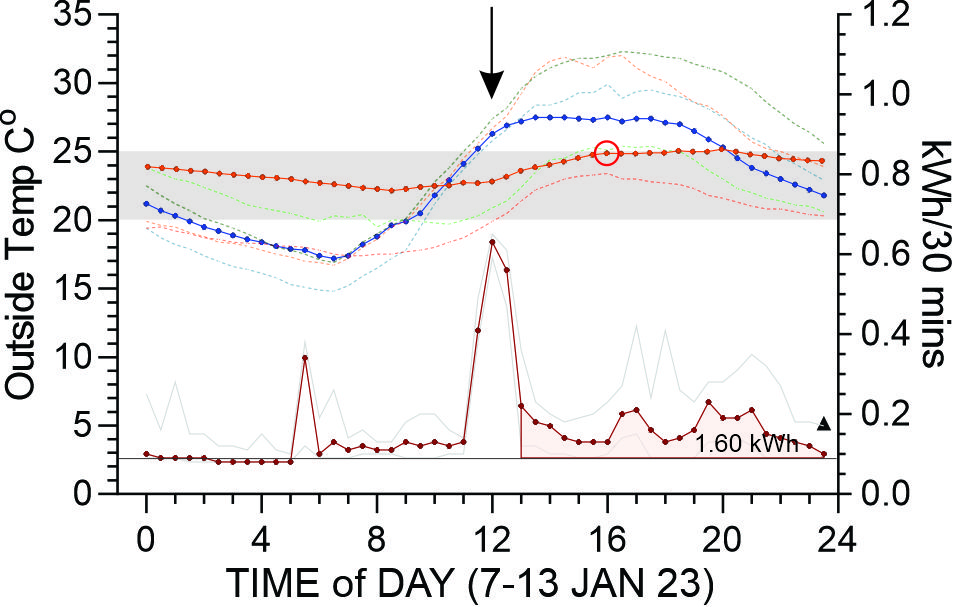
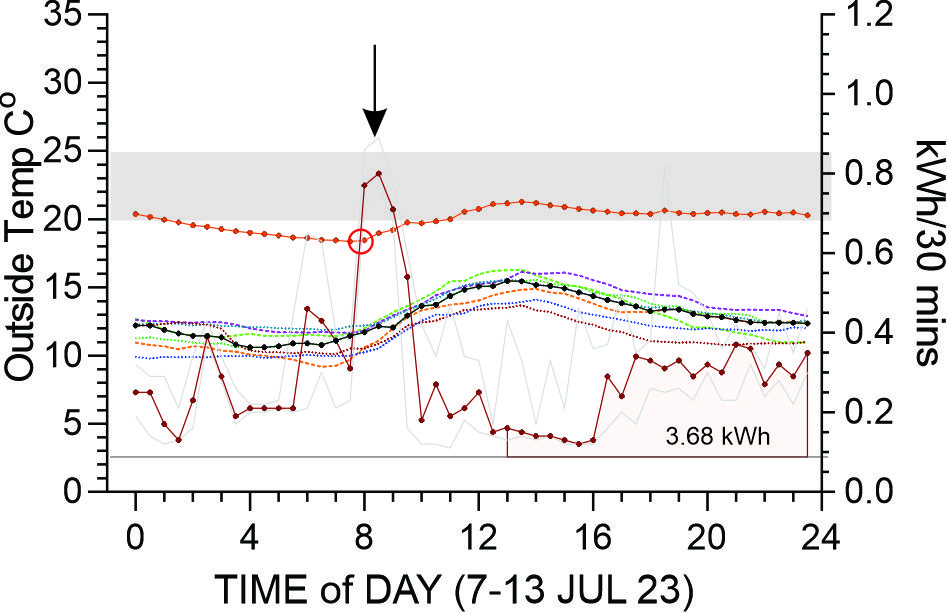
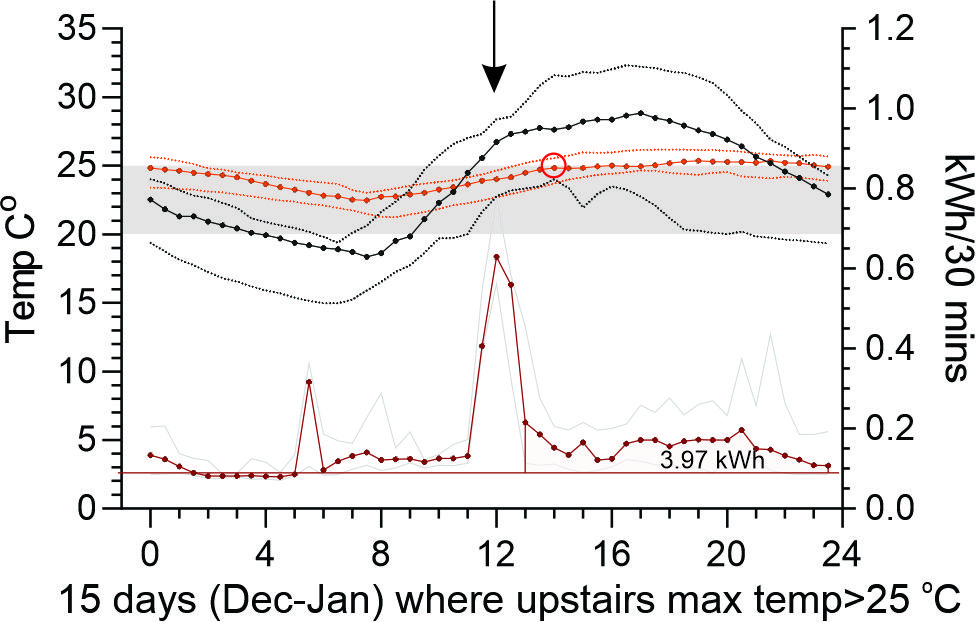
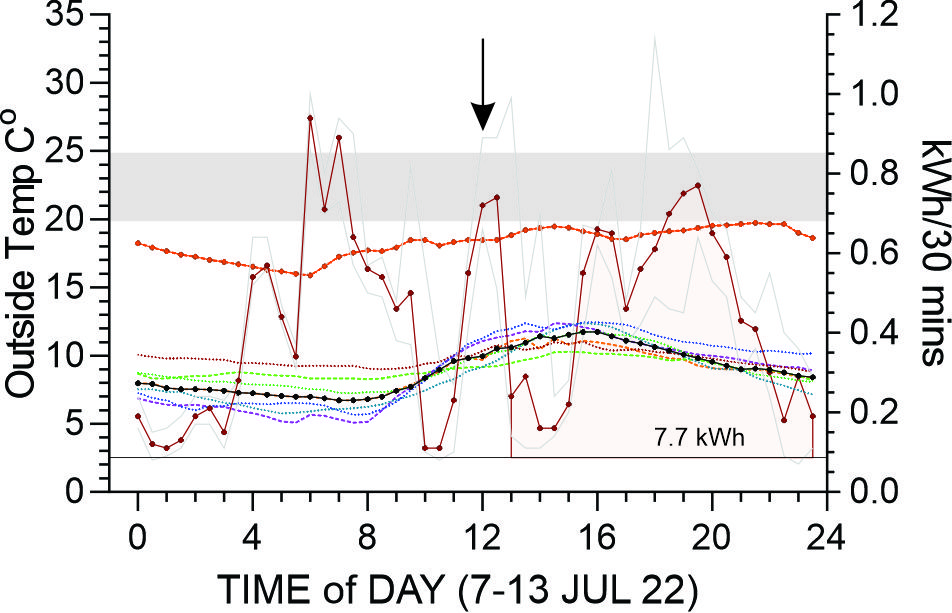
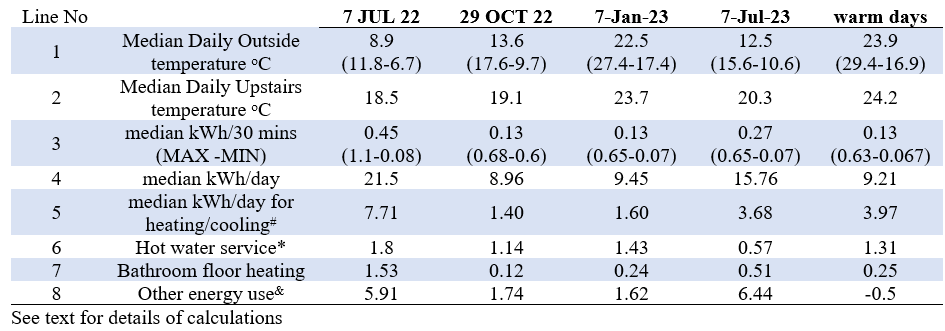
The energy consumption of Park house was less than the model predicted in both warm and cool months. To gain further insights into how energy was consumed, the consumption of the course of the day was averaged in 4 different weeks and also from “warm” summer days. These five periods were chosen because they represented different environments and two (9th July in 2022 and 2023) were to compare the effect of 12 months of experience in how to “drive” the house. The “warm” days were 15 days in December 2022 and January 23, chosen because the maximum upstairs temperature exceeded 25oC and so it is possible that the reverse cycle cooling system was used. All five graphs and Table 1 can be considered together to make the following observations. The methods are described at the end of this page, but it is possible to get a good understanding of the main points without reviewing the methods in detail. The main points are:
- As predicted, more energy is used in heating than cooling. However, Fig 3 (Energy consumption for heating and cooling: Part 1) suggests that energy consumption would be greater on days when median daily temperature ~14oC (eg 29 OCT) than on days when the median temperature was 22oC (eg 7 Jan).
- Energy consumption was less in Jul 2023 than in Jul 2022. While the 2022 week was ~5oC colder, there was notable higher energy consumption but a colder intererior. This suggest that better use of heating systems (eg bathroom heating and reverse cycle system) achieved a lower energy outcome with a warmer interior.
- “Warm” days (median peak ~27.5oC) did not require substantially more energy than 29 October when median daily outside temperatures peaked at ~17o
- 2022 and 2023 were very mild summers and we await the coming el nino to examine the energy consumption and performance on a run of days with temperature > 35oC.
METHOD
Below are the methods for estimating the values in each of the lines in Table 1
Median kWh/30 mins (MAX -MIN) – Line 3 in Table 1. At each 30 minute point of the day, the median kWh from the 7 days was calculated and plotted. As well the median Maximum and Minimum of each of the days was also calculated. Note that for most of the graphs the Maximum energy consumed was at 12:00, by the hot water service.
Median kWh/day – Line 4 in Table 1. For each day, the kWh from each 30 minutes was summed top give the Total energy for that day. The median total energy of the 7 days was then calculated. Base level of consumption has been removed.
Median kWh/day for heating/cooling– Line 5 in Table 1. This was estimated by calculating the First the total kWh between 13:00-24:00 minus base consumption (0.09 kWh/30 mins) of each day was calculated and the mean of these values was taken. Note that each dot on the median line of the energy use on the graph is the median at that time of day and will not be the same as the median of the total consumption. See above for discussion about errors that may be associated with the assumptions that heating and cooling occurred only between 13:00-24:00. It will include evening cooking.
Hot Water Service (HWS) – Line 6 in Table 1. This came on for ~ 2 hours each day (11:00-13:00) and shows as a peak at that time (see vertical arrow at 12:00). The heat pump was serviced in May 2023 and the time of heating was switched to 08:00-10:00 (see 9Jul 23). The daily energy for HWS was the sum of the consumption was the sum of the kWh for each of 4 thirty min periods minus base consumption (0.09 kWh/30 mins x 4).
Bathroom floor heating – Line 7 in Table 1. There is excess (ie above Base level) energy consumption before 06:00: typically between 04:00-10:00. In the winter months this is most likely the floor heaters which were on for longer periods at higher settings and in both bathrooms in 2022 than in 2023. In 7 Jul 23, they were not use in the upper bathroom and set at lower temperatures. There were also discrete peaks at 05:00-06:00 in summer months and these are likely caused by the garden watering pumps which were on for longer periods in the warmer months (when floor heating was off).
Other energy use – Line 8 in Table 1. This is the remainder when Lines 5-7 (Table 1) are subtracted from Total energy use each day (Line 4, Table 1). It includes Base level of consumption. As this is 4.32 kWh which is in excess of the remainder in spring and summer, it is clear there are significant errors in the assumptions here.
Base level of consumption. Examination of the period 00:00- 05:00 in weeks 29th Oct, 7th Jan and the hot days, indicates that there is a low or “basal” level of energy consumption. The dotted line indicates the mean: 0.09 kWh/30 minutes. It is likely that the ERV was on during this period in weeks of 29th Oct because the outside temperature at this time was in ranges that would causes excess cooling or heating if windows were opened. The base level of energy for a day is 4.32 kWh (0.09 * 48). In each of Lines 5-7, Base Level energy was removed.
