Energy Consumption for Heating and Cooling: Part 2
Comparison with the PHPP Model


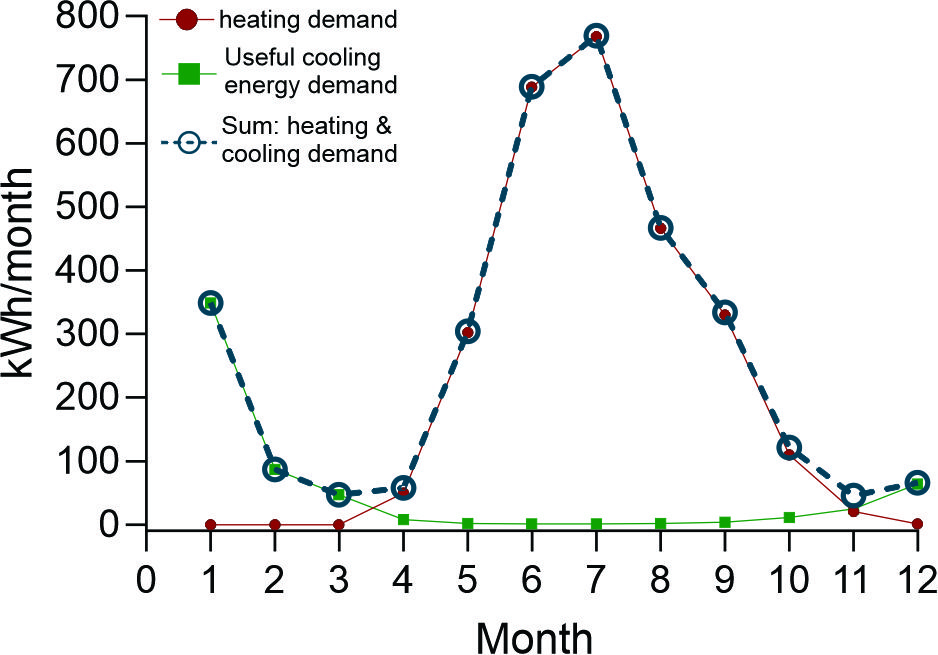
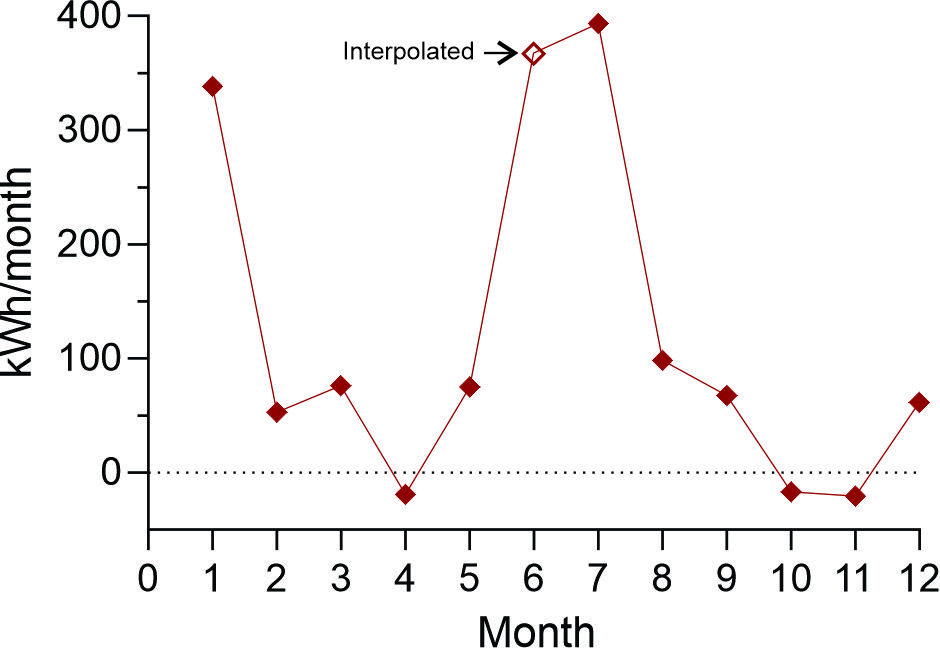
Figure 3 is the difference between the open blue circles of Figure 1 and the burgundy triangles of Figure 2 (or the difference between “the Sum of the heating and cooling demand according to PHPP model” and the “the total monthly energy used in Park House minus the basal consumption of 3111 kWh/p.a.”. Positive values indicate an overestimation by the PHPP model.
A previous page (Energy Consumption for heating and Cooling Part 1) described a Basal Energy consumption. This was the energy consumed when the house was vacant in winter and in the warmer months December-March) and amounted to 8.5kWh/day or 3111 kWh p.a. While it is not possible to detail the precise contribution of various appliances in the house it is interesting to compare the PHPP modelling.
In estimating daily “Basal” energy consumption the model included Dish & clothes washing, Refrigeration, Cooking, Lighting, Consumer electronics, Small appliances in forming an estimated annual energy consumption shown in Table 1. of 1755 kWh (daily=4.8kWh). ERV consumption was based on 100 Wh used at 100% between April and November and 0% in the other 4 months. The PhPP model was developed on 3.1 persons and estimated an annual energy consumption of 4341.4 kWh and 11.9 kWh daily consumption. In table 2, the estimates have had a pro rata reduction to a 2 person occupancy and shows an annual energy consumption of 3352 kWh and 9.2 kWh daily consumption which is very close to the actual consumption (See Table 1).

PHPP model of heating and cooling demands
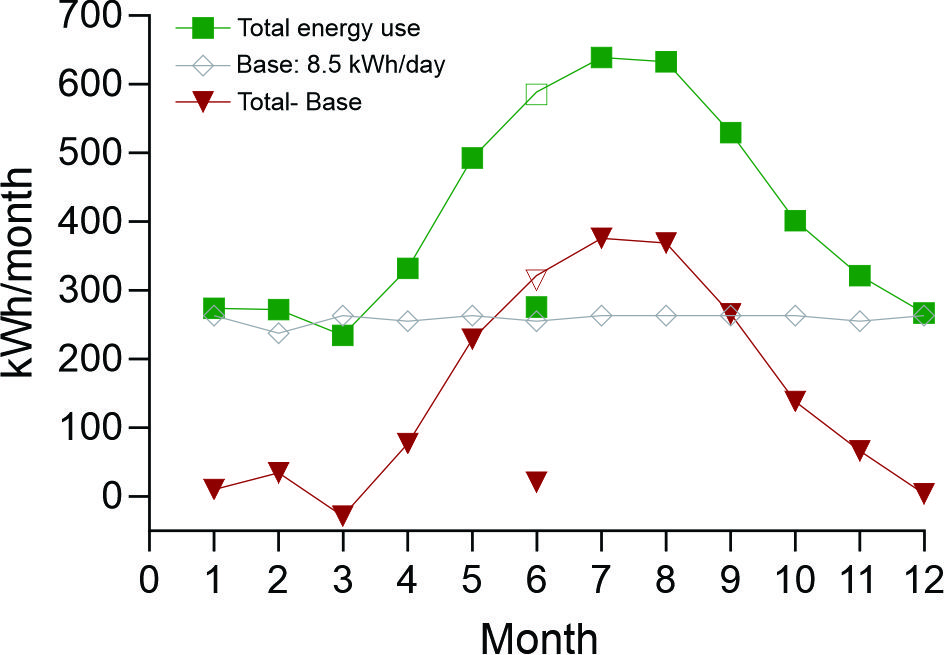
The PHPP model estimates the “Useful cooling demands” and the “Heating Demand” which are indicative of the energy required for cooling and heating respectively. These are plotted in Figure 1. They are summed (open blue circles in Figure 1) to allow a comparison with the estimates of the actual energy used for cooling and heating (Figure 2). Figure 2 shows the Total Energy use in each month (green squares) and the estimate of the energy used for cooling and heating (red triangles, estimated as “Total energy minus the base energy”: grey diamonds).
Figure 2 plots the total energy consumption in kWh/month (green squares: Y axis) in Park House against the months of the year. The base demand is ~ 8.5kWh/day or 3111 kWh/p.a (as calculated in the previous blog and plotted as the grey open diamonds). Each grey diamond represents 30 minutes of energy and thus approximates 8.5 kWh/48 or 0.177 kWh. The house was vacant in June (month 6) and the actual energy use is shown as a filled green square. Note that the estimated basal consumption is a close approximation to the value of filled green square. The energy for heating and cooling is estimated as the difference between the Total and the base use and plotted in burgundy triangles. This is compared with the PHPP model in Figure 3 below.
Inspection of these two Figures (1 and 2) shows that the PHPP overestimated energy demands for cooling and heating. This is represented in Figure 3 where the “Sum of heating &cooling demand in the PHPP Model” is subtracted from the “Total Monthly energy - Basal consumption” (The Open blue circles and dotted line of Figure 1 and the red triangles in Figure respectively). The overestimates are most marked in January, June and July.
Conclusions
- Energy requirements for winter heating are far greater than for winter cooling and were predicted by the PHPP model
- Energy needs for cooling are modest
- the PHPP model predicted a greater energy demand than was actually required