Energy consumption for heating and cooling: Part 1
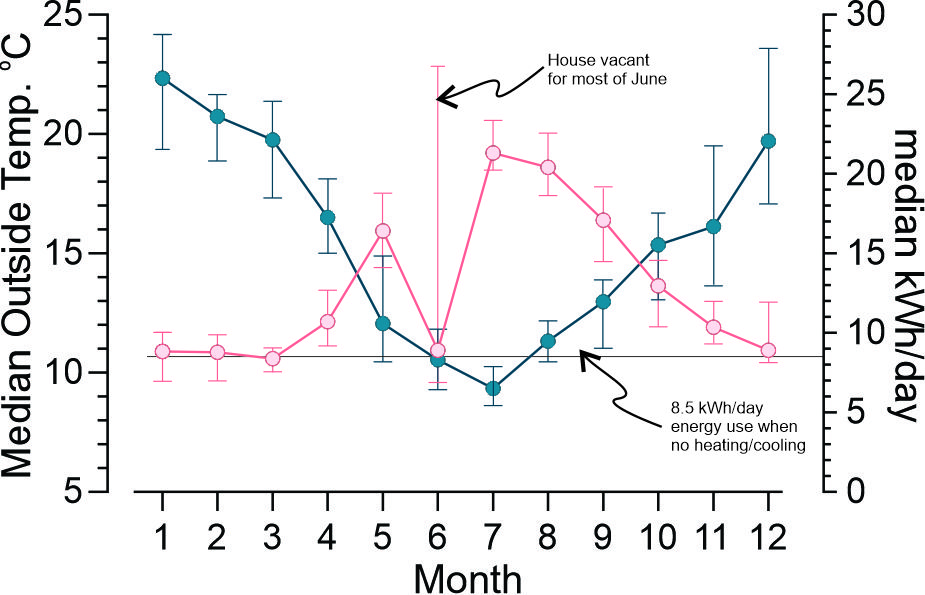
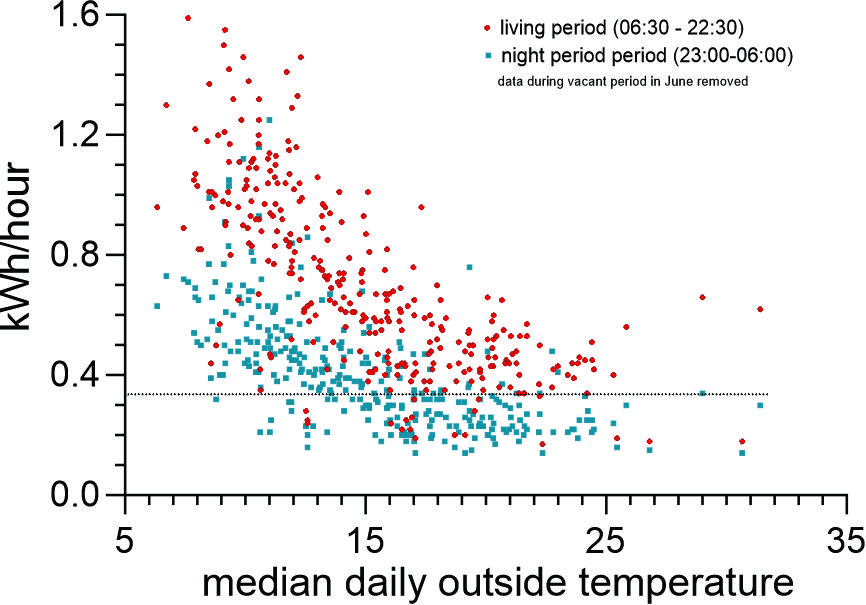
Figure 2 The Y axis shows the median energy consumption for the relevant period adjusted for a nominal hourly consumption.
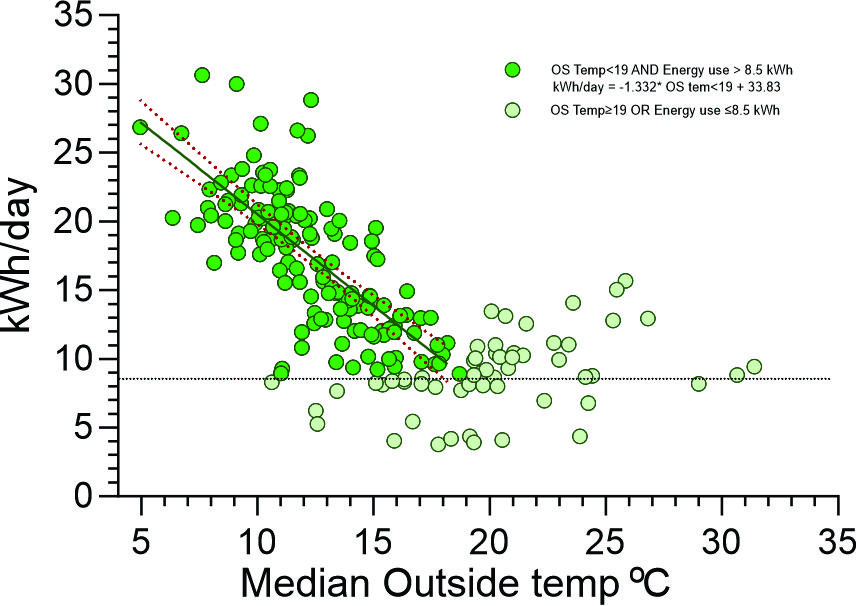
Figure 3 plots the energy consumption each day (Y axis) against the Median outside temperature of that day. The dark green circles represent days in which the Outside temperature than 19oC and the daily energy consumption was greater than basal 8.5 kWh (to remove points when the house was vacant). A regression line was fitted to these data points showing that energy consumption increased by 1.33 kWh/day for every drop in outside temperature of 1oC.
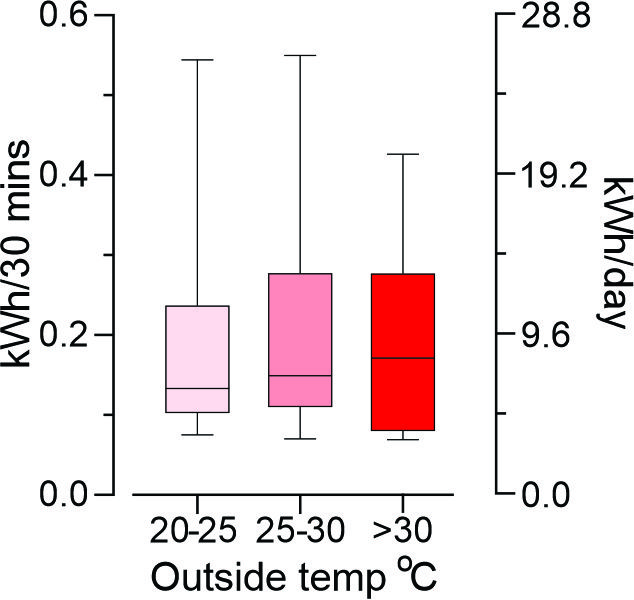
Figure 4 shows the energy consumption in the 30 minute epochs (Y axis) coinciding with external temperatures of 20-25oC, 25-30oC and >30oC . The Right Y axis shows the daily energy consumption commensurate with the energy consumption in 30 minutes shown on the Y axis. The median energy use when external temperature was 20-25oC was 1.82 Kwh/day less than when the temperature outside was >30oC.
A smart electricity metre provided energy consumption every 30 minutes allowing this to be compared with temperature measurements over the same time interval. While the house was unoccupied for ~ 20 days in June, the heating and ERV was turned off but most of the other appliances remained on. This period was used to obtain the house’s base line energy consumption (8.5 kWh/24 hours).
Figure 1 shows the median daily Outside temperature (Left Y axis) and the median daily energy consumption (Right Y axis) plotted for each month. Greatest energy consumption was during cold months including those months prior to the addition of a reverse cycle system.
Note that energy consumption from December – March is the same as when the house is vacant. In these months energy is only for cooking, hot water and other appliances (washing machine fridge etc). The ERV is only turned on when windows are all closed and this is predominantly in cold weather and when the external temperature exceeds ~25Co. There are also floor heaters in the bathroom to reduce condensation which are only on in cool months.
The energy consumption during the living period (06:30-22:30) and night period (02:00-6:30) of each day was plotted against the median temperature of that day. The energy consumption has been expressed as kWh/hour to allow the two periods to be compared. The dotted line shows the hourly equivalent (0.35kWh) of the daily basal energy consumption (8.5 kWh/24 hours). Note that the reverse cycle system but not the ERV will be turned off during the night period on days when all windows are closed, and the bathroom floor heaters will come on prior to 06:30 on cold days. In Figure 3, the total energy consumption of each day was plotted against the median outside temperature. A linear regression was fitted to those points where the median outside temperature was less than 19oC and the daily energy consumption was greater than basal 8.5 kWh (to remove points when the house was vacant). This suggest that an extra 1.33 kWh/day is used in heating for every degree under 19oC.
Summer of 2022 and 2023 were cooler than usual but very little energy was used in cooling the house. Some impression is gained from the points in Figure 3 where the median daily temperature was>24oC, but Figure 4 shows the energy consumption in the 30 minute epochs coinciding with external temperatures >30oC or less than 25oC (or in between). The median energy use when external temperature was 20-25oC was 1.82 Kwh/day less than when the temperature outside was >30oC.
The annual energy use of the house was then examined over the four seasons and compared with “average” 3 and 2 bedroom Melbourne house. This comparison is difficult because the Park house is designed to accommodate a family of four but occupied by 2 people. The two main points are that energy consumption was less than average 2 person household in total, mainly because energy use in the warm months was less whereas energy use in cold months was greater. When Basal Energy use (see above) was subtracted from the total energy use there was very little energy consumption in Summer at park house.
Conclusions
- Park house managed hot weather very well. Most likely this was because the bedrooms remained cool on hot days. Further data from hot summers is required.
- Most of the energy was spent in managing the cold weather.