Relation between interior and external temperature: Part 3

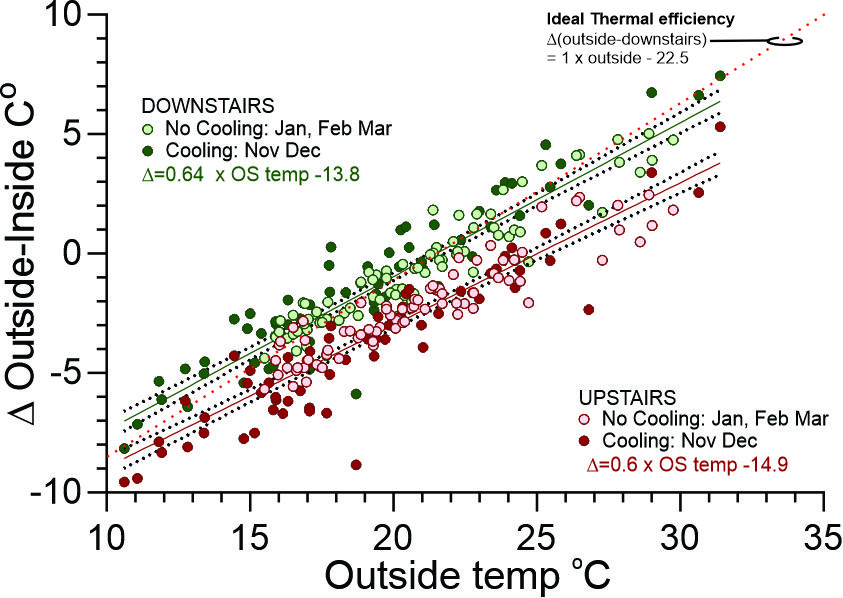
Upstairs data is plotted in red with the November and December (reverse cycle heating and cooling availble) with solid circles and January, February and March (no reverse cycle heating and cooling availble) as open circles.
Downstairs data is plotted in green with the November and December (reverse cycle heating and cooling availble) with solid circles and January, February and March (no reverse cycle heating and cooling availble) as open circles.
The regression lines and their assocuated formulae are shown for Upstairs and Downstairs in their respective colours.
The thin dotted red line shows a fully effecient enclosed space whose internal temperature is 22.5 degrees.

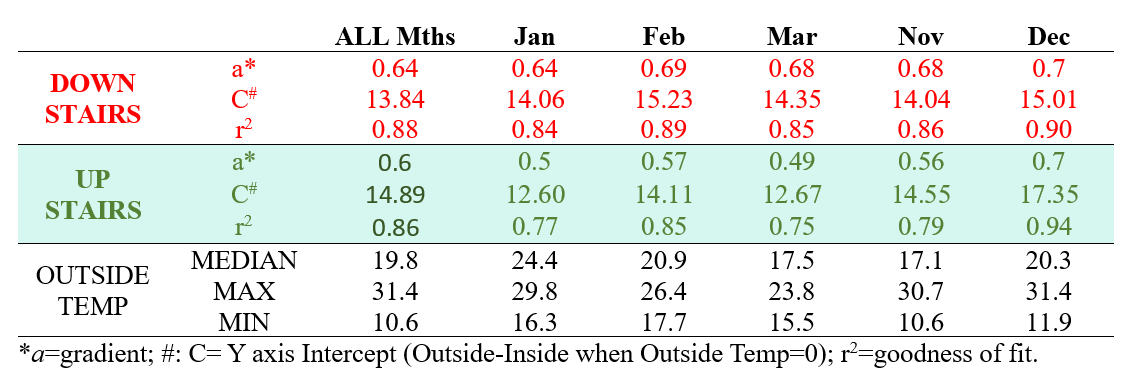
The previous two blogs that examined the relation between interior and external temperature focussed on cold months (see links to right). This posting will focus on warm months (January, February, March, November and December). The external temperature range of these months in shown in the Table below. Heating and cooling was only available for the last two months.
Upstairs
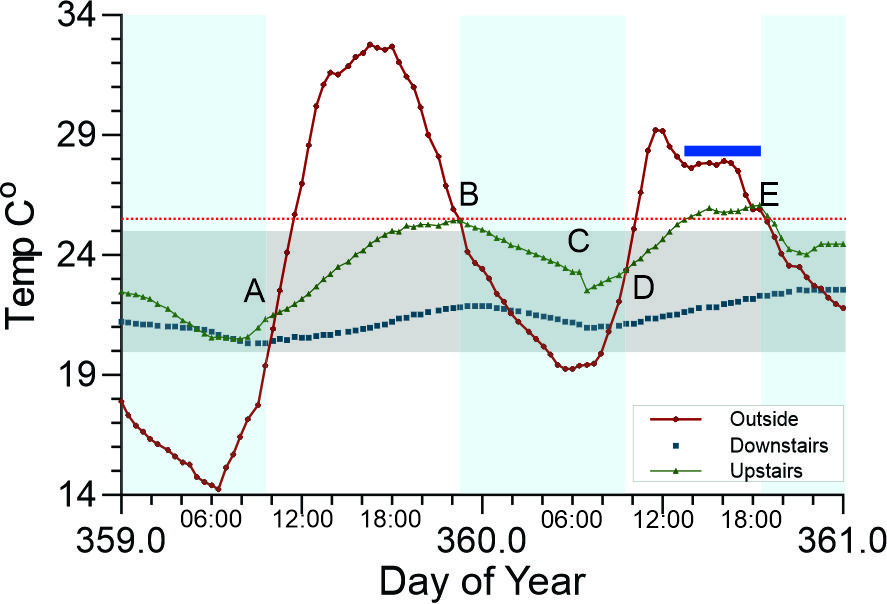
The gradient (“a”) of the slope in Figure 1 was considerable less than the colder months (typically 0.6 or less compared to ~ 0.8 in July and August. The comfortable upstairs temperature (22.5oC) occurred at 19 oC Outside and the upper limit of the comfort zone occurred (without cooling) when the Outside temperature exceeded 25oC. In the previous postings it was concluded that the gradient (“a”) indicated the thermal efficiency of the space. In colder months the windows and doors were closed and only the ERV recycled air whereas in these warmer months more than 50% of the time the windows would be open. Typically, windows were open when the outside temperatures were less than 22oC (noting that only in January was the median above 22oC). Opening the windows makes a leaky or thermally less efficient space. Figure 2 shows how the temperatures were actively managed by opening windows and use of the reverse cycle cooling. At Point "A" in Figure 2, the windows were closed due to rapidly rising external heat (note slowing in rise of internal temperature). At around 18:00, the Upstairs temperature hovered just below the threshold for reverse cycle cooling and at "B" (a little after 22:00) the Inside temperature exceed the Outside and the windows were opened. At "C" next morning all windows were opened wide to purge heat (see small drop in temperature) and then all windows were closed at "D". The reverse cycle system came on just before 14:00 until 18:30, when windows were opened. This active use of windows is typical in warmer months.

Downstairs
In the warmer months, the Downstairs was ~3oC cooler than upstairs when the Outside temperature was above 25oC. Consequently it would only be when the external daily median temperature was >32oC that the downstairs temperature exceeded 25oC. This does not address the problem of latent heat when the minimum external temperature does not fall below 25oC for several days preventing overnight heat purging and allowing a build up of latent heat.