Relation between interior and external temperature: Part 1
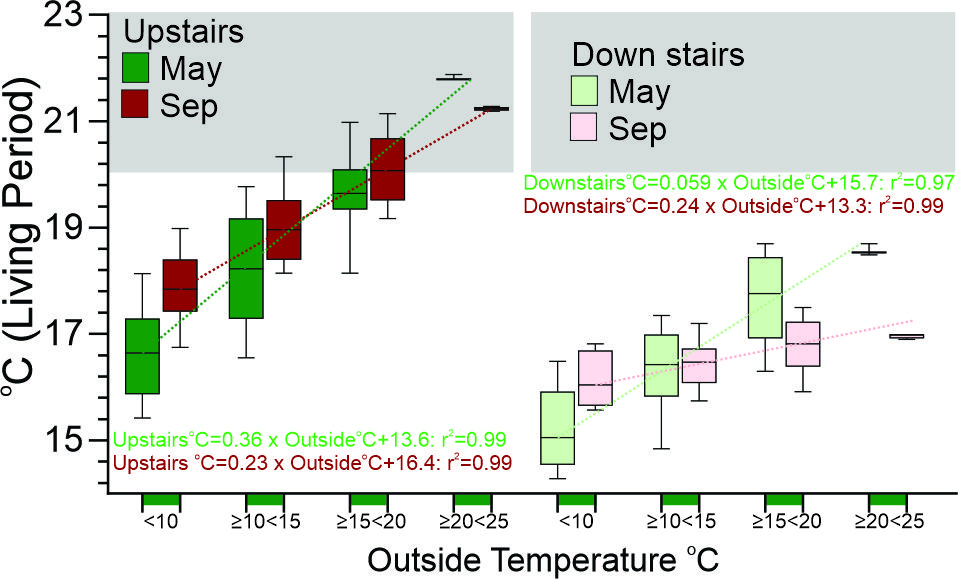
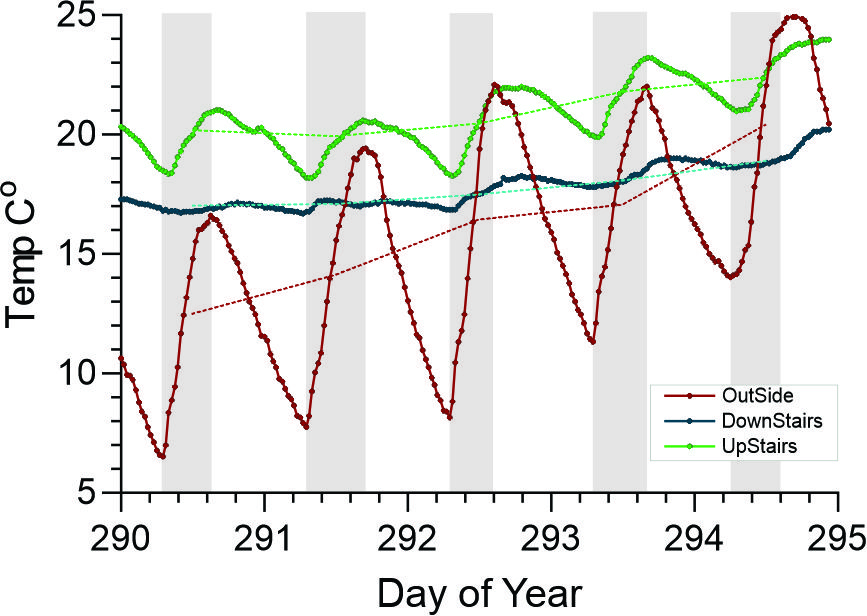
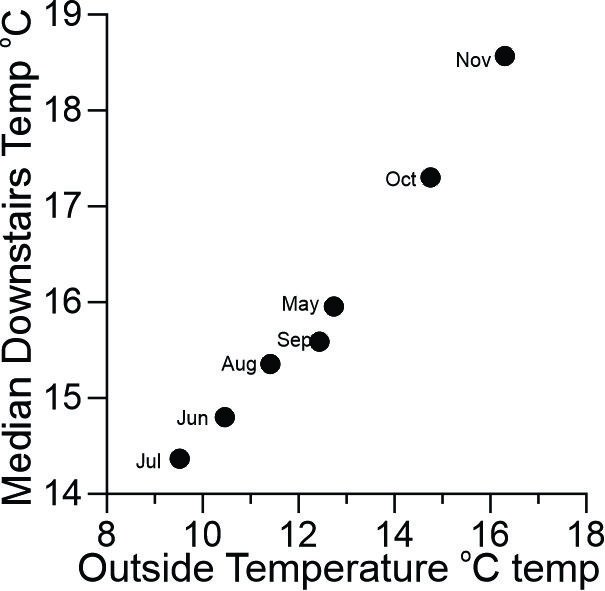
Figure 2 plots the median Downstairs temperature on days when the median outside Temp was between 10-12oC (Y axis) against the Median daily temperature of the relevant month (X axis).
There was a clear increase in Upstairs temperatures following the installation and use of the reverse cycle unit in July (see Figure to the right). The effect of heating on the relationship between external and internal temperatures can be examined by comparing May and September temperatures (olive bars in Figure to the right). These months were chosen because they have similar external temperatures (mean and standard deviation: May12.0±3.0; Sep 13.7±2.8)
Figure 1 shows that the Upstairs temperatures in May and September are linearly related to the Outside temperatures. When the Outside temperature is 10oC, the Upstairs September temperatures will be 1.23oC higher than in May. The Downstairs temperatures in May and September are also linearly related to the outside temperatures but the difference when the outside temperature is 10oC is larger (2.74oC).
The difference between the Upstairs temperatures in May and September could be attributed to the use of the heating unit in September. However, 88% of measurements where the outside temperature<10oC occurred before 08:00 am and may be before the heater was turned on and most other outside temperatures were associated with an Upstairs temperature close to or above 19oC, which is the setting for the heater to switch on. It suggests that in the early morning the upstairs is already warmer in September than in May, raising the possibility that in September, heat held within the fabric of the building from the night before contributes to it being warmer when the outside temperature is at 10oC. This is also supported by the observation that the September Downstairs temperatures are almost independent of the outside temperature while May temperatures are more variable. The explanation for this behaviour is examined further in future Blogs (see links to left).
Examination of external and internal temperature measurements over 5 days is instructive (Figure 2). Despite diurnal swings of ~10oC in the external temperature, the upstairs temperature varies by around 1.5oC each day and Downstairs be less than 0.5oC and there is a lag between peak temperature outside and inside of about 1.75 hrs. However the lag in change in median temperature is much more marked: the external median temperature changes by 2oC each day but the interior temperatures only begin changing on the third day and this delay suggests thermal inertia while heat is absorbed into the building fabric. Another insight comes from examining the median Downstairs temperature on days in each month when the median Outside temperature was between 10-12oC (Figure 3). If only the daily Outside temperature determined the inside temperature, then the inside temperature should be around 11oC: instead it was strongly correlated with the median monthly temperature. Thus warmer months have more days in which heat is stored in the buildings fabric and this heat maintains the temperature on colder days. In other words the building has thermal inertia that buffers against temperature variation (especially downstairs).
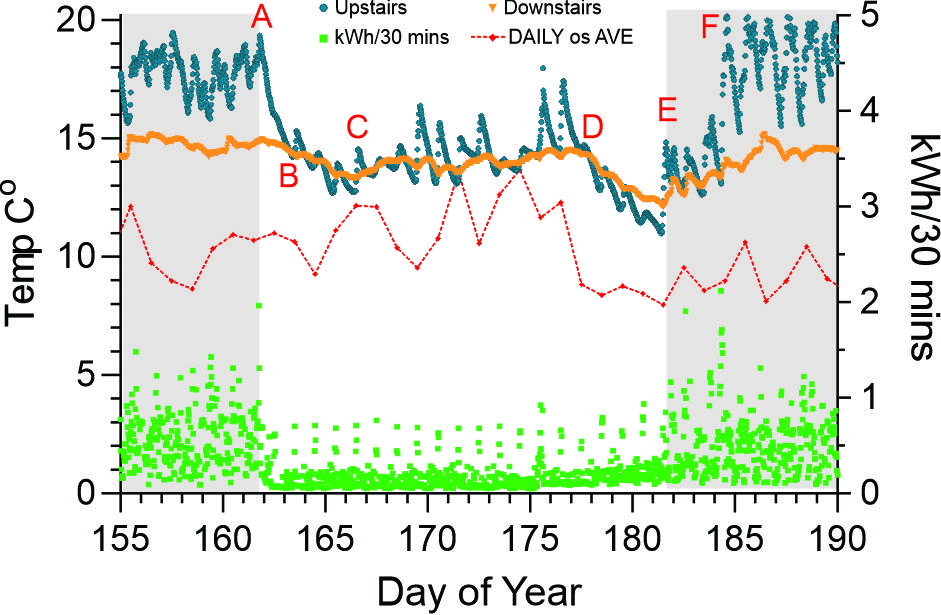
The changes in in internal temperature when the house is vacant can also provide insights about heat held in the building. The house was vacated on the 162nd day of the year (11th June) for an extended period all appliances other than fridge and hot water service were turned off (“A” in Figure 4: note sharp drop in energy consumption:). During day 155-172, the median daily temperature varied between 8.6 and 21.1oC with an average of around 10.5oC: in other words it was stable. In the first 2 days, the Downstairs temperature only fell 0.5oC (“B” in Figure 3) while the upstairs temperature fell by 5oC to be similar to the Downstairs temperature, followed by a further fall of about ~2oC over 3 days ("B" to "C"). This temperature was maintained until Day 178 (“D”), when the Outside temperature again fell sharply to a median of ~8.5oC, which was maintained for several days. Both internal temperatures rooms again fell be ~2oC over 3 days (“E”) until the house was reoccupied and heating commenced (“F”). Several conclusions can be drawn:
- The difference between upstairs and Downstairs temperatures before “A” and after “E” can be attributed to upstairs heating (bodies, cooking etc, and after “E” the reverse cycle heating unit). The fall in Upstairs temperature reflects mainly the absence of this heat. The drop in Upstairs temperature to equal Downstairs temperature takes ~40 hours (indicating thermal inertia).
- The fall in temperatures after “B” and “D” likely reflect the slow loss of heat within the fabric of the building noting that the outside temperature was not changing when this decline in temperature was occurring. The two periods (“B” & “D”) show that Upstairs temperatures will decline at 0.33 oC/hour or 0.79 oC/24 hours when the outside temperature is colder than Upstairs. Similarly, Downstairs temperatures will decline at 0.19 oC/hour or 0.46 oC/24 hours when the outside temperature is colder than Downstairs.
- The Downstairs temperature is far more stable and less influenced by external diurnal change than Upstairs temperature. It is affected by longer term changes over several days. This suggest a much greater thermal capacitance.
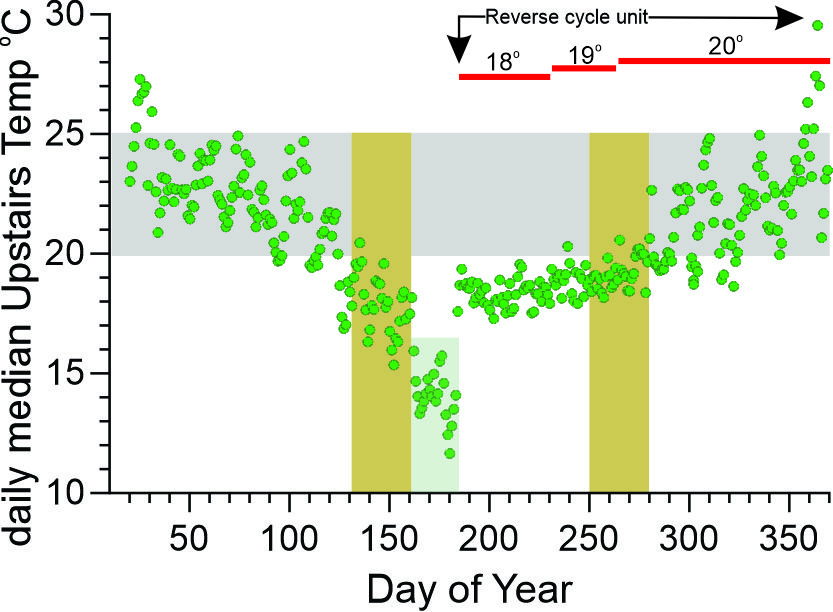
This Figure shows the the median daily Upstairs temperatures during the Living Period. The Reverse cycle system began operating at Day180 and explains the abrupt increase in temperatures. The house was vacant Day 162-185 (shaded green). The red bars indicate the setting for warming to commence. The olive bars indicate May and September.
Relation between Internal and External temperature: Part 3