Time spent in Comfort Range

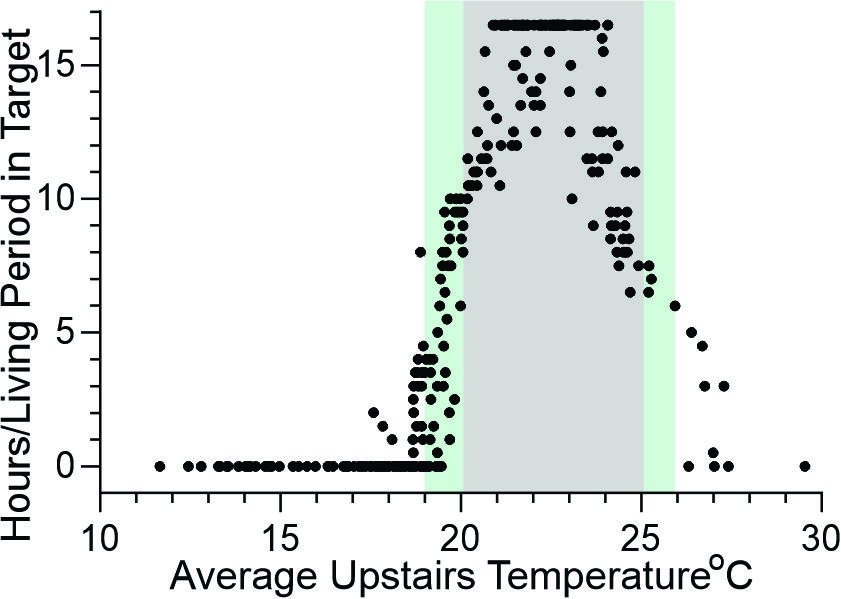
Figure 1 shows the hours in the living period (max 17 hours) of each day that the Upstairs Temperature was in Targetr Range (Y axis) plotted against the mean Upstairs temperature of that day (X axis).

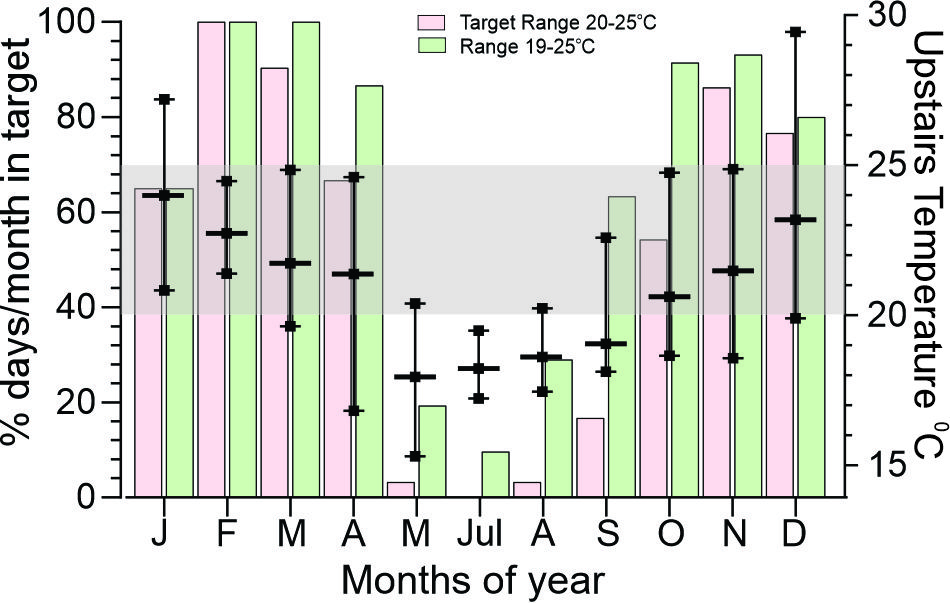
Figure 2 shows the percent of days in each month in the Target Range (pink bars) or in the target range plus 1 degree below (green bars). The black lines show the median, Maximum and minimum median daily temperatures in the month (Right Y axis).
Time Temperature within Comfort Range.
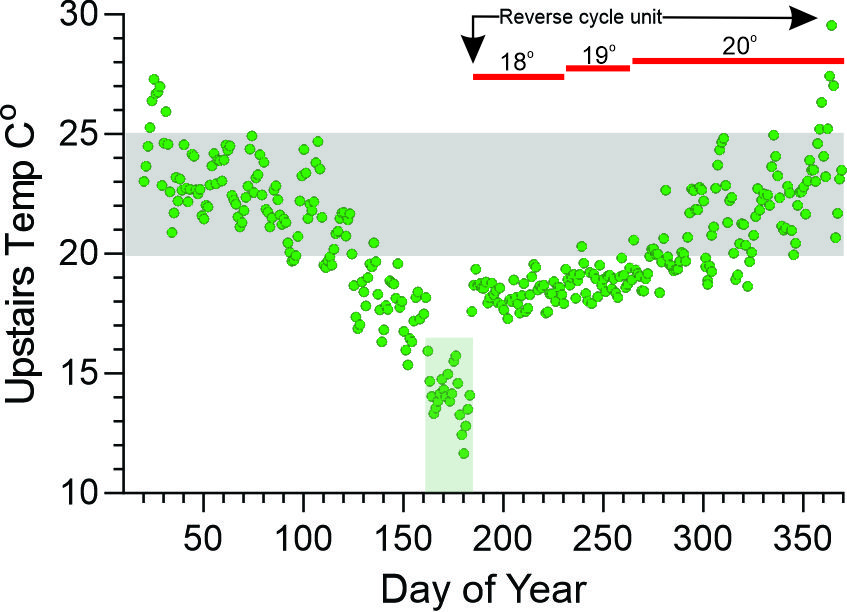
The living comfort of Park House can be judged by the median daily Upstairs Temperature (Figure to right), which was below the Comfort Range between Day 120 (~beginning of May) and Day 270 (end of September). Interpretation of this data is informed by knowing that the reverse cycle unit began functioning on ~ Day 182 and was initially set to warm at 18oC (the comfort zone of one of the occupants!) and progressively increased to 20oC (the comfort zone of another occupant- see markers in Figure to the right).
Further understanding is gained from examining the number of hours of the Living Period that were in Target (Figure 1 & 2). Figure 1 shows that when the temperature is <19oC, almost no hours are in the target temperature. These occurred in May, July and August (Figure 2). It is important to note that the Living Period is 06:00-22:30 and in “normal living” in winter, people may not be occupying (and therefore heating) the Upstairs in the early or late hours or this period: 4 hours removed from 17 hours is ~25%.
The main conclusion is that heat loss during winter was a more significant issue than heat gain in summer.
The main conclusion is that heat loss during winter was a more significant issue than heat gain in summer.
- 2022 winter was mild and data from a hot summer would be interesting.
- 2022 winter was mild and data from a hot summer would be interesting.
- External temperatures in August and September were (just) colder than May, yet Upstairs temperatures in those months was warmer, indicating the effect of reverse cycle heating .
- It is possible that allowing the fittings and fabric (walls, floor etc) of the house to lose heat will require greater heating to restore internal temperatures (see Energy Consumption for Heating and Cooling: Part 3. Consumption over course of the day).

This Figure shows the the median daily Upstairs temperatures during the Living Period. The Reverse cycle system began operating at Day180 and explains the abrupt increase in temperatures. The house was vacant Day 162-185 (shaded green). The red bars indicate the setting for warming to commence.
Consumption over course of the day